Workforce
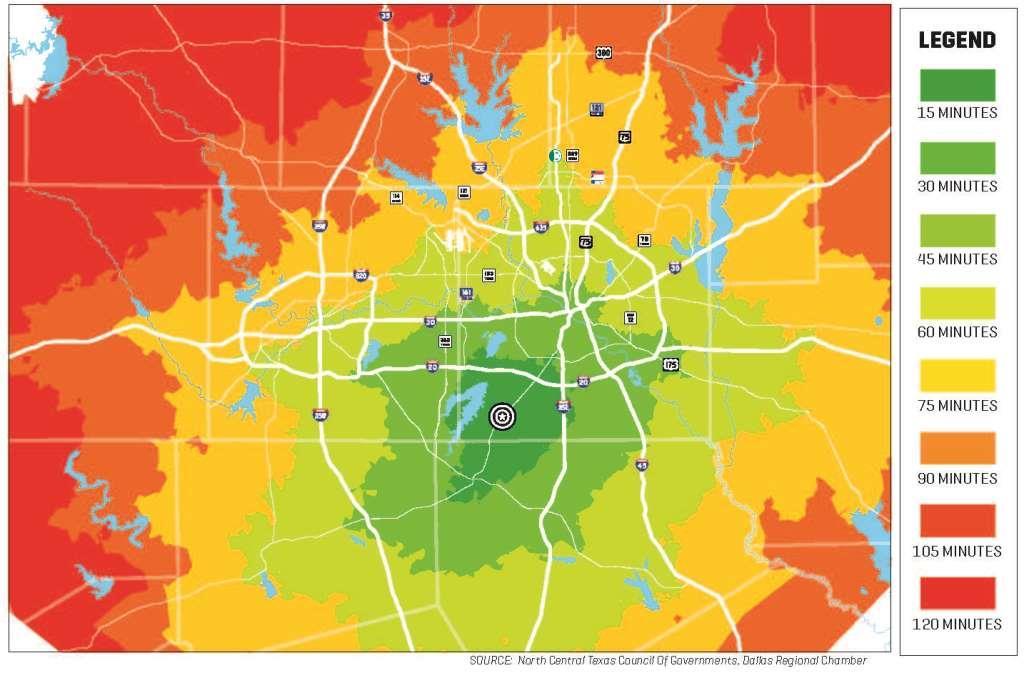
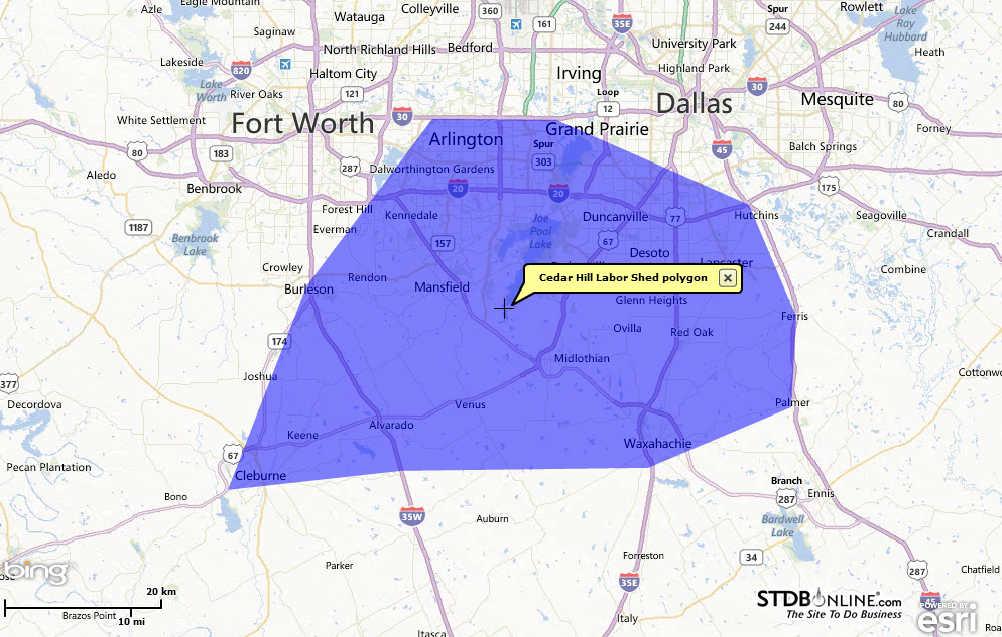 Cedar Hill's location in the DFW Metroplex allows employers to pull from a large area for workforce. The labor shed (illustrated to the right) is able to provide employees with various skills and experience. It also enables Cedar Hill residents to easily commute to other areas.
Workforce Employment
|
Cedar Hill
|
Ellis County
|
Dallas County | |
| Unemployment Rate (May 2015) |
4.3%
|
3.5%
|
3.9% |
| Labor Force |
37,431
|
121,605
|
1,901,923 |
| Employment |
25,136
|
1,182,861
|
75,300 |
| In Armed Forces | 61 | 60 | 986 |
| Not in Labor Force | 10,043 | 39,463 | 601,586 |
Source: Claritas Site Reports and Texas Workforce Commission, 2015
Occupational Mean Wage Rates
| Occupation | National | DFW Area |
| All Occupations | $22.71 | $22.92 |
| Management | $54.08 | $57.94 |
| Business & Financial Operations | $34.81 | $36.25 |
| Computer & Mathematical | $40.37 | $40.05 |
| Food Preperation & Serving-Related | $10.57 | $10.26 |
| Sales & Related | $18.59 | $20.83 |
| Office & Administrative Support | $17.08 | $17.36 |
| Construction & Extraction | $22.40 | $18.20 |
| Installation, Maintenance, & Repair | $21.74 | $21.00 |
| Production | $17.06 | $16.15 |
| Transporation & Material Moving | $16.57 | $15.72 |
|
Source: Bureau of Labor Statistics, 2015. For more information on wage rates, click here. |
Workforce by Class of Worker
| Class |
Cedar Hill
|
15-Minute Drive
|
| For-Profit Private Workers |
66.56%
|
70.78%
|
| Non-Profit Private Workers |
7.42%
|
6.33%
|
| Local Government Workers |
8.61%
|
7.90%
|
| State Government Workers |
3.73%
|
3.77%
|
| Federal Government Workers |
4.80%
|
4.16%
|
| Self-Employed |
8.79%
|
6.87%
|
| Unpaid Family Workers |
0.09%
|
0.19%
|
Source: Claritas Site Reports, 2015
Workforce by Occupation
| Occupation |
Percentage
|
| Architect/Engineer |
1.48%
|
| Arts/Entertainment/Sports |
2.48%
|
| Building Grounds Maintenance |
2.67%
|
| Business/Financial Operations |
6.19%
|
| Community/Social Services |
2.33%
|
| Computer/Mathematical |
2.46%
|
| Construction/Extraction |
3.29%
|
| Education/Training/Library | 6.11% |
| Farm/Fish/Forestry | 0.09% |
| Food Prep/Serving | 3.62% |
| Health Practitioner | 4.09% |
| Healthcare Support | 2.22% |
| Maintenance Repair | 3.16% |
| Legal | 0.85% |
| Life/Phys/Social Science | 0.46% |
| Management | 9.87% |
| Office/Administrative Support | 21.96% |
| Production | 4.67% |
| Protective Services | 2.30% |
| Sales/Related | 8.17% |
| Personal Care | 2.85% |
| Transportation/Moving | 8.69% |
Source: Claritas Site Reports, 2015
Occupational Classification
| Type |
Percentage
|
| White Collar |
66.44%
|
| Blue Collar |
19.81%
|
| Service & Farm |
13.75%
|
Source: Claritas Site Reports, 2015
Workforce Transportation
| Type of Transportation |
Cedar Hill
|
15-Minute Drive
|
| Drove Alone |
81.51%
|
80.91%
|
| Car Pooled |
10.55%
|
10.89%
|
| Public Transportation |
0.89%
|
2.70%
|
| Walked |
1.14%
|
1.10%
|
| Bicycle |
0.08%
|
0.06%
|
| Other Means |
1.82%
|
1.72%
|
| Worked at Home |
4.02%
|
2.62%
|
Source: Claritas Site Reports, 2015
Travel Time to Work
| Travel Time |
Percentage of Workforce
|
| < 15 Minutes |
16.41%
|
| 15-29 Minutes |
29.26%
|
| 30-44 Minutes |
31.03%
|
| 45-59 Minutes |
13.25%
|
| 60 + Minutes |
10.05%
|
| Average Travel Time |
33.73 Minutes
|
Source: Claritas Site Reports, 2015
Drive-Time Map